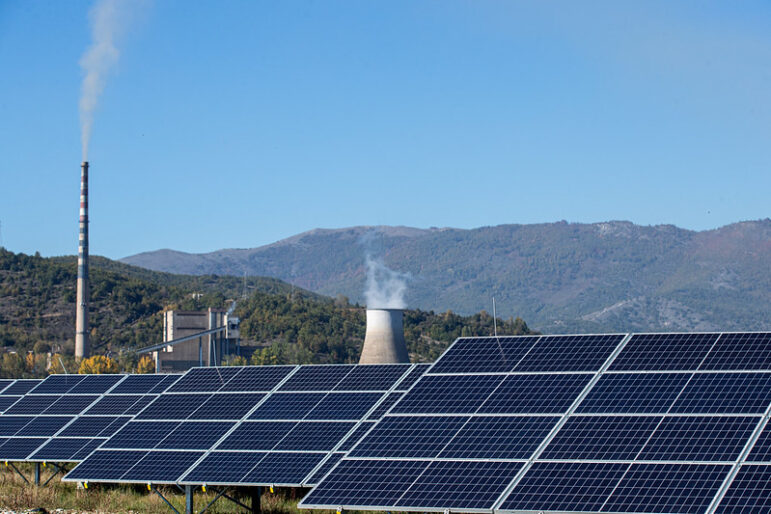
Satellite imagery of the Amazon rainforest. Image: Shutterstock
Journalists’ Guide to Using AI and Satellite Imagery for Storytelling
Reporter’s Guide to Investigating Carbon Offsets — Short Version
How to Identify and Investigate AI Audio Deepfakes, a Major 2024 Election Threat
Tipsheet for Investigative Journalists on War Crimes and Open Source Research
Holding Your Government Accountable for Climate Change Pledges
Editor’s Note: This article was originally published on Notion. It is republished here with permission from the authors. It is part of an ongoing series of cross-posts GIJN is running on AI and investigative journalism.
This is the story of how our team of journalists and data enthusiasts — a collaboration that emerged from the 2021 JournalismAI Collab Challenges — went about using artificial intelligence to identify visual indicators within satellite imagery to chase a story. We thought our tool could be used to identify illegal airstrips built in a remote area, or the expansion of deforestation in a jungle, or whether a public road is indeed being built.
A visual indication of a specific change in the terrain, or spotting peculiar infrastructure from above, could turn into an investigative story. If you are doing an investigation and are trying to figure out if satellite images could be fundamental to verify findings — or to gather new evidence and you have no idea where to start — this guide is made for you.
Our team (with members from Bloomberg News, CLIP, DataCritica, and La Nación) was keen on exploring the usage of satellite imagery along with applied computational techniques for writing stories. We knew that satellite imagery possesses information that could potentially enhance our ability to write compelling narratives about the state of our planet, cutting across multiple beats. Such a tool tends to be complex and out of the reach for many journalists. So we wanted to create a replicable workflow that could be used for story ideas and projects.
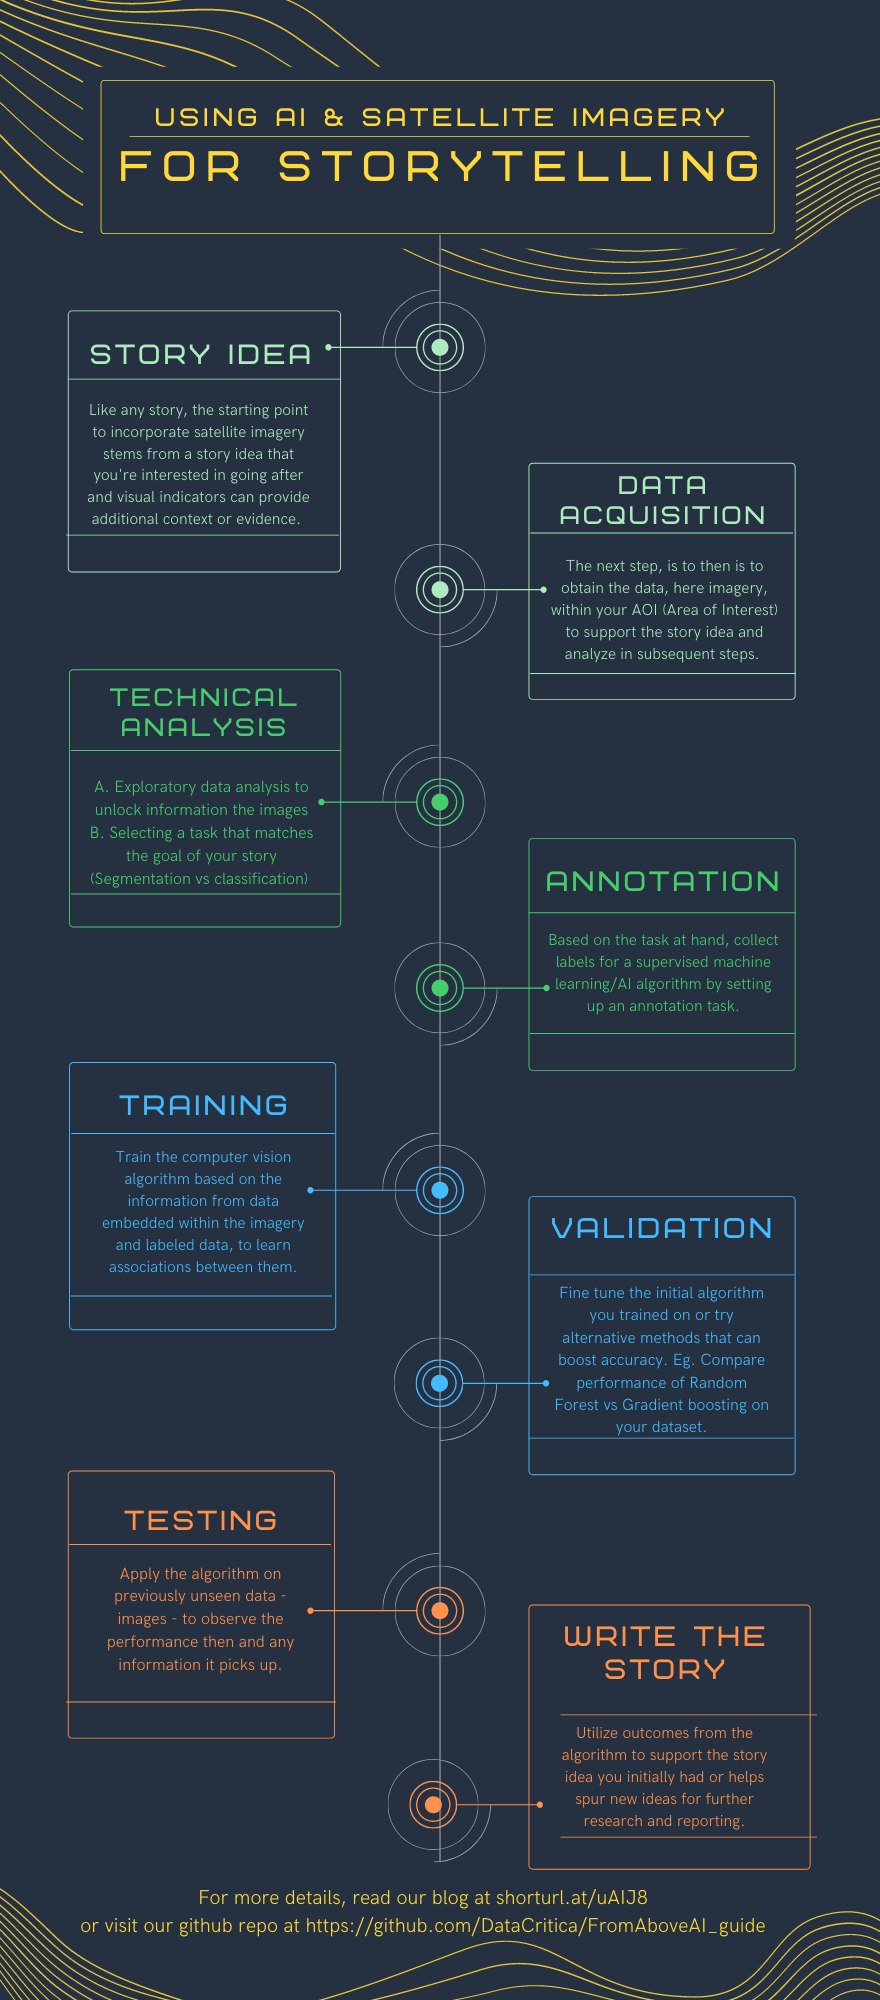
One-page satellite data guide with high-level steps. Image: Courtesy of From Above team
Our common interest was to look at the climate crisis through this lens, so we started with the first, vital step of any story: ideas. We gathered research and pitched multiple story ideas within our group that could be extrapolated using imagery of forests, coastlines, and other geographic elements, and narrowed down on trying to detect illegal cattle ranching within the protected forests.
In Mexico: Data Crítica obtained information about the presence of cows in protected areas in the southeast of Mexico. These areas are of high relevance, as some of them represent the largest humid tropical forests in Mexico and Central America. This information is relevant to obtaining images with a high likelihood of bringing quality data for training an algorithm, and then detecting other similar areas by applying this algorithm to new areas, in some cases disregarded before this exercise.
In Colombia: CLIP, together with local partner 360, supported by the Pulitzer Center on Crisis Reporting, identified a high density of cows at the border of four national parks that are key transitional ecosystems to protect the Amazon jungle, through cow vaccination data. To better place the cows on the map, we also collaborated with the Fundación para la Conservación y el Desarrollo Sostenible (Fcds) with ample, on-the-ground knowledge of these forests, as sources for geographical shapes in these regions differ. The most updated data available was 2020. Identifying the cows in satellite images would allow us to evaluate the current situation and establish whether cattle and the deforestation that comes with it had continued to expand.
Getting, Storing, and Processing Satellite Imagery
Once we set our sites on chasing any indication of illegal cattle ranching within the protected forests of the Amazon, our next step was to acquire imagery that could support us. This would be the main ingredient to the computer vision algorithms that we wanted to try and train. Initially, we set out with an ambitious goal to target the four South American countries (Mexico, Colombia, Brazil, and Argentina) that our respective news organizations had covered, but soon we realized we had to narrow down our areas of interest, as this step was much more complicated than we had anticipated.
Access to satellite imagery is more widely available than ever, but getting higher-quality imagery — resolutions where object detection is possible — comes at a high cost. Despite trying to get in touch with the biggest providers — like Maxar, Planet, Sentinel, Google Earth — we found it hard to get a response to queries when you’re interested in a collaboration or a small project. But, soon enough, we found there are a growing number of programs that allow free access and/or downloads of satellite images to organizations and journalists in pursuit of specific goals, and pivoted to that as a source.
We used Planet’s NICFI program aimed at the conservation of biodiversity. These images have a resolution of 4.7 meters per pixel, higher than Landsat images, but with less bands associated.
Two criteria to keep in mind at this stage:
- Cost and availability of imagery: Cost depends on quality, and quality depends on the type of detection you need for your story. For instance, detecting cows is a far more granular task than detecting the presence of patches in a large field in our case. Or, more generally, image-labeling.
- Storage and processing of imagery: Good quality satellite imagery requires about 0.3 GB per 100 sq. kilometers. That translates to roughly two terabytes of imagery to cover an area the size of Texas, up to 26 terabytes to cover an area the size of Brazil. Keeping the area limited will allow for realistic storage and processing capabilities. If we want to do any sort of change detection (comparing an area to how it looked a year ago, for example) that doubles the storage capacity needed.
Understanding Available AI Techniques
We drew conclusions by finding out who had tried to develop smart algorithms to detect changes, phenomena, or animals on the ground from satellite images. This meant:
– Talking to experienced people and documenting their techniques.
– Finding an appropriate AI/computer vision technique to process the images.
We also wanted to talk to those who had worked on projects that leveraged satellite imagery in combination with machine learning techniques.
Here are takeaways from our interviews and research:
- Many AI techniques are available to process images to decompose the information it contains and then create new associations to spot additional information.
- For instance, we needed to train an object-identification algorithm to spot livestock from the imagery, but utilize time series analysis over multiple images to spot changes within the forest regions. This increased the computational challenges and helped us formulate a technical pipeline in the initial prototype stage.
- We found that Texty.org.ua, a data journalism agency in Ukraine, had done a similar project in Leprosy of the Land, which applied a machine model to detect amber mining on satellite images ,and how it was creating a lunar-like landscape on over 70,000 square kilometers. We interviewed Anatoly Bondarenko from Texty.
- We also spoke with Alfredo Kalaitzis of the Counting Cows project. (You can view the data from this project on GitHub.)
- Since cows are not a fixed thing, any images with lower definition than 0.5 meters per pixel will only work if taken at nadir (the point directly below the observer). Even images taken at a 10 degree angle will affect the resolution. However, surroundings can work as a proxy for cattle — such as fencing, stables, farmland, water holes — if counting the cows is not the goal, but rather establishing presence or absence. This was key for us at From Above, as we finally went for the proxies in lieu of the actual counting of cows.
- Their project got the high resolution images from their partner, Global Witness, which had bought them from Maxar with crowdsourced funds. You can pay to task a satellite to take pictures of a given area, but you can also just buy the licensing to some images someone else has already tasked. They were allowed to release the project with snapshots of original images. From this recommendation, our team looked for a partner who could have the images. La Nación got funding for only one high definition image of 0.3 meters per pixel. They declined it because it wasn’t enough to run an algorithm.
- Their project cut images to 100 by 100 tiles to annotate. And it took them a few hours and more consistency to annotate collectively. We followed their example and annotated collectively and found it very useful for speed and consistency.
- The storing of images is not such a big problem in some cases, like ours. When you are looking at specific areas, you can run the process we created using a regular PC — with at least 16GB of RAM, the more RAM the better — and a standard 1 TB hard drive, as you are training and applying algorithms one tile (of dozens of kilometers long) at a time. Nevertheless, if you wanted to store and process several of these satellite tiles simultaneously, or otherwise upscale the process — for instance, to look into the area of whole countries — cloud computing services might become necessary.
“We believe that the main limiting factor to such applications is the access to high-resolution images, and not the development of counting algorithms. Also, the identification of a specific individual requires resolutions that are not yet available in commercial satellites” — Counting Cows project’s Alfredo Kalaitzis
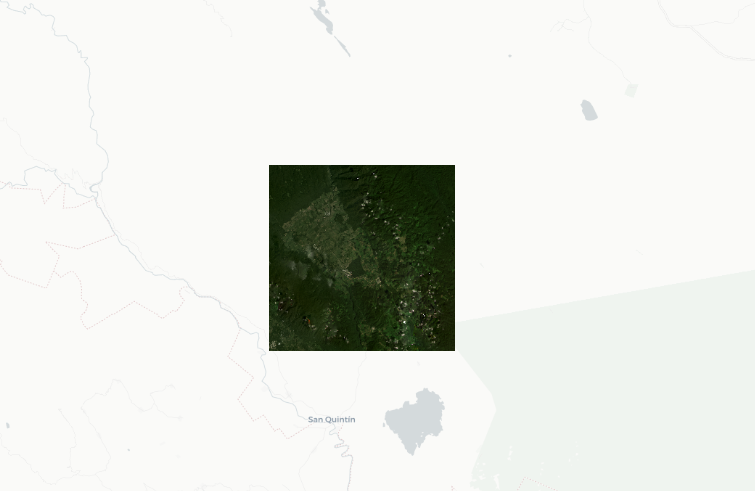
Area of Interest in the Mexican humid tropical forests. Image: Courtesy of From Above team.
Pivoting and Focusing Our Efforts
Despite trying to get in touch with the biggest satellite imagery providers, we found it hard to get a response to queries for a collaboration or small project. But soon enough, we found there are a growing number of programs that allow free access and/or downloads of satellite images to organizations and journalists in pursuit of specific goals, and pivoted to that as a source.
If we could not have access to HD imagery up to 0.4 meters per pixel, we were not going to be able to detect cows.
“Let’s hope we can at least get it for one of the countries and see the whole process running. If not possible, we can change to another pitch of research with larger object detection so we can make use of freely available imagery.” — Flor Coelho, From Above team member
We had data sources in Argentina, Mexico, and Colombia, and had a good idea of the problems that arose from them: technical, cost of images, clouds, historical high-definition imaging, and others. We gave up on identifying individual cows. We discovered that other elements could reveal cows in a protected area, such as barns, fences, roads, straight lines on farm boundaries, and man-made waterholes.
We decided to develop the land-use approach we had talked about earlier in the collaboration. We would identify farming, using images of lower resolution than the ones needed for detecting cattle. We went over how RGB — red, green, blue — and infrared lenses help to analyze object detection. Satellites can use RGB lenses or infrared to identify different things better.
With this information, we concentrated on developing a tool that would allow us to detect livestock (cattle) in areas that are either protected or were previously covered by forests in Argentina, Brazil, Colombia, and Mexico.
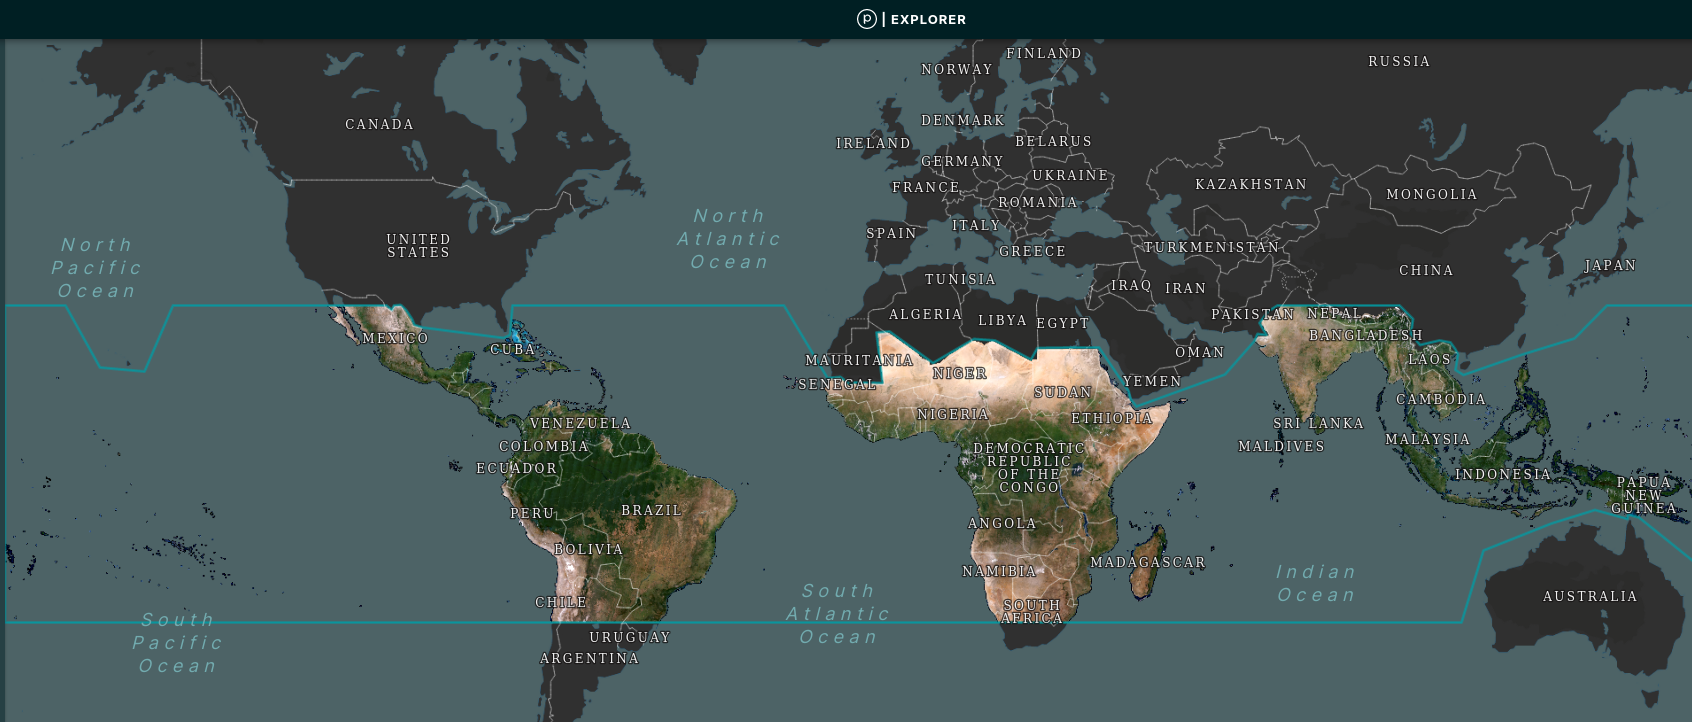
We also decided to use Planet’s NICFI program.
Once you have Planet’s NICFI account, take note of the difference between Planet’s Basemaps Viewer and Planet’s Explorer online. The first one allows you to download “analytical” images, with the several layers referred to previously. Once in Planet’s Basemap (or any other satellite imagery source), you should distinguish clearly between the downloadable “visual” composites and the “analytical” composites. The second set are encoded with the several bands we have referred to before. Visually, Explorer and Basemaps look almost the same, but only the second one allows for images to be downloaded for processing and data extraction/modeling.
Annotation Criteria and Guidelines
We decided to collect labels for the image segmentation task at hand, and chose a tool (GroundWork) that suited our team’s working preferences while balancing the data and time constraints of the challenge. It was also important for us as a group to set and agree upon on the guidelines with which we annotated the images for our Area of Interest (AOI).

Images: Courtesy of From Above team
You can use the visual composite (the one with less layers) for annotating. What you are getting after the annotation process are the polygons or points you draw for each element you try to identify on the land (and their references in latitudes and longitudes). Later on, you’ll match that information to the reflectance information encoded in the satellite image.
You should choose an annotation tool based on the advantages and disadvantages it represents for your specific mission. There are great tools online for annotation, like OpenCV or Cvat, though we couldn’t test them thoroughly.
For instance, some tools allow for seamless online collaboration, but might prevent you from uploading images of higher resolution than those from Planet (4.7 meters per pixel). In that case, you can use an offline process, such as using programs like QGIS or R within your own computer system.
However, we wanted to annotate collectively to ensure consistency and speed, and working offline could make the collaboration a little more cumbersome.
We decided to use GroundWork, which is pretty easy to use to annotate collectively.
The journalism open-source experts, Bellingcat, teamed with us, and not only provided us with training to manage Planet’s tools, but also gave us some very high-resolution images in the area of the parks where we were spotting cows in Colombia. These were images taken by previous tasks run by Planet, to which Bellingcat had access through a paid account.

The From Above team chose to identify seven different landmark classifications when studying their areas of interest. Image: Courtesy of From Above team
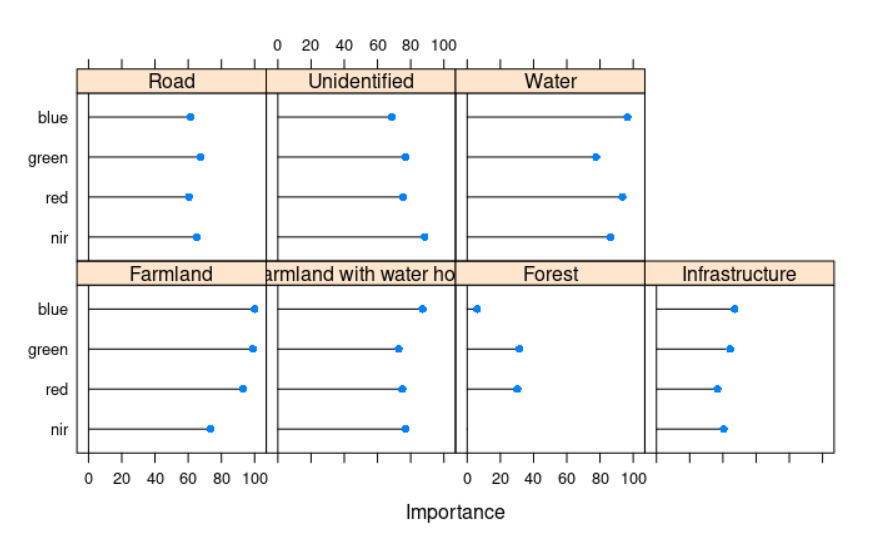
We chose seven labels (water, forest, farmland, farmland with water hole, infrastructure, road, and unidentified) to use in our supervised algorithm.
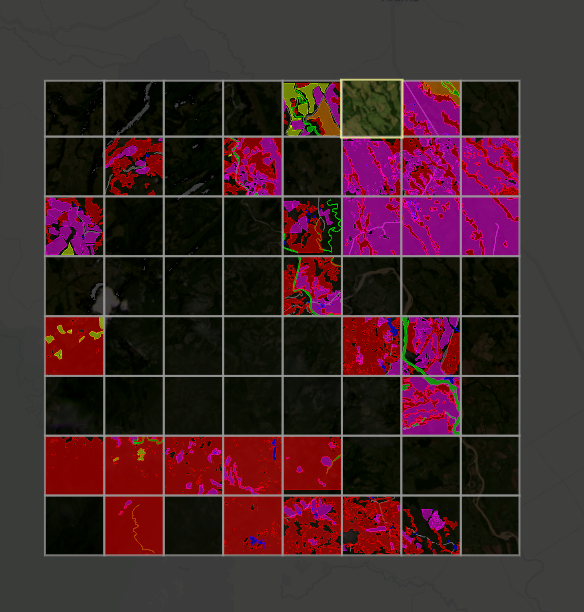
Image: Courtesy of From Above team
This image was broken into smaller tiles that we annotated tile by tile. Colored tiles have been annotated, but the rest were still unmarked during the time of this screenshot.
For instance, Bellingcat provided us with some very high-resolution images that we couldn’t upload to GroundWork, due to a glitch in their application. That forced us to continually verify our annotation with some high-resolution map available online, such as Google Earth.
We spent around three hours annotating together, and another 15 hours annotating individually, once we had agreed on useful labels and established some consistency on what was forest, water, farmland, etc. We annotated each tile of four images: two from Colombia’s parks, and two from Mexico’s reserved area.
Technical Pipeline — Step by Step
We had two essential pieces of data or information to work with:
- Original satellite image — data from layers of the raster image (in a tiff file format).
- Annotated image — data labeled in the annotation process (in GeoJSON file format).
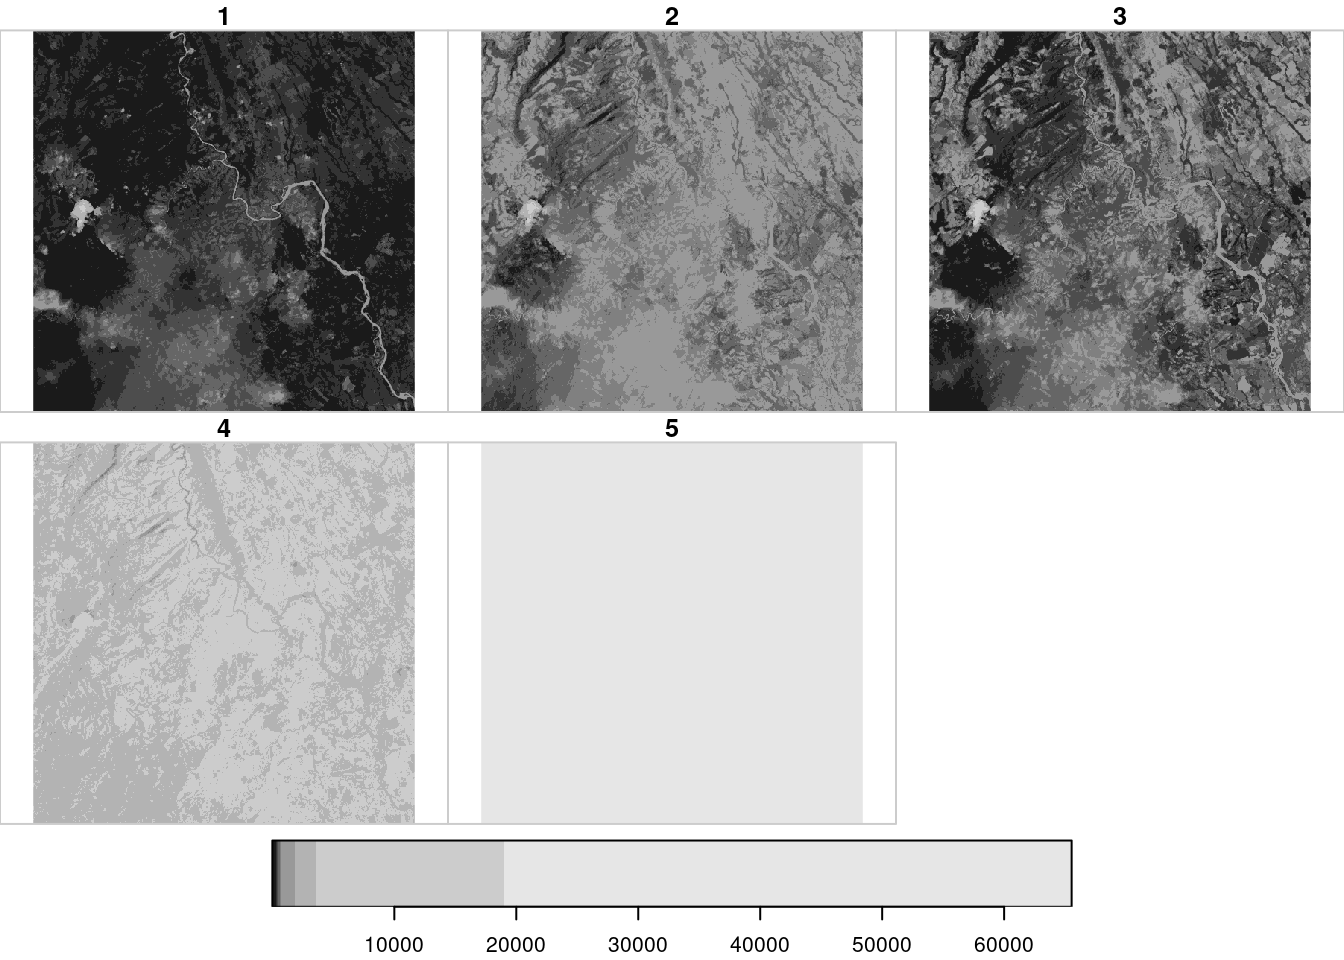
In this array, you can see the analytic image downloaded into five layers: red, green, blue, near-infrared, and an additional “alpha” layer. Some programs, like this one, render these different colors in grayscale. Image: Courtesy of From Above team
The following steps helped us extract information invisible to the human eye, and learn associations between the layers and from the labels to build our initial prototype:
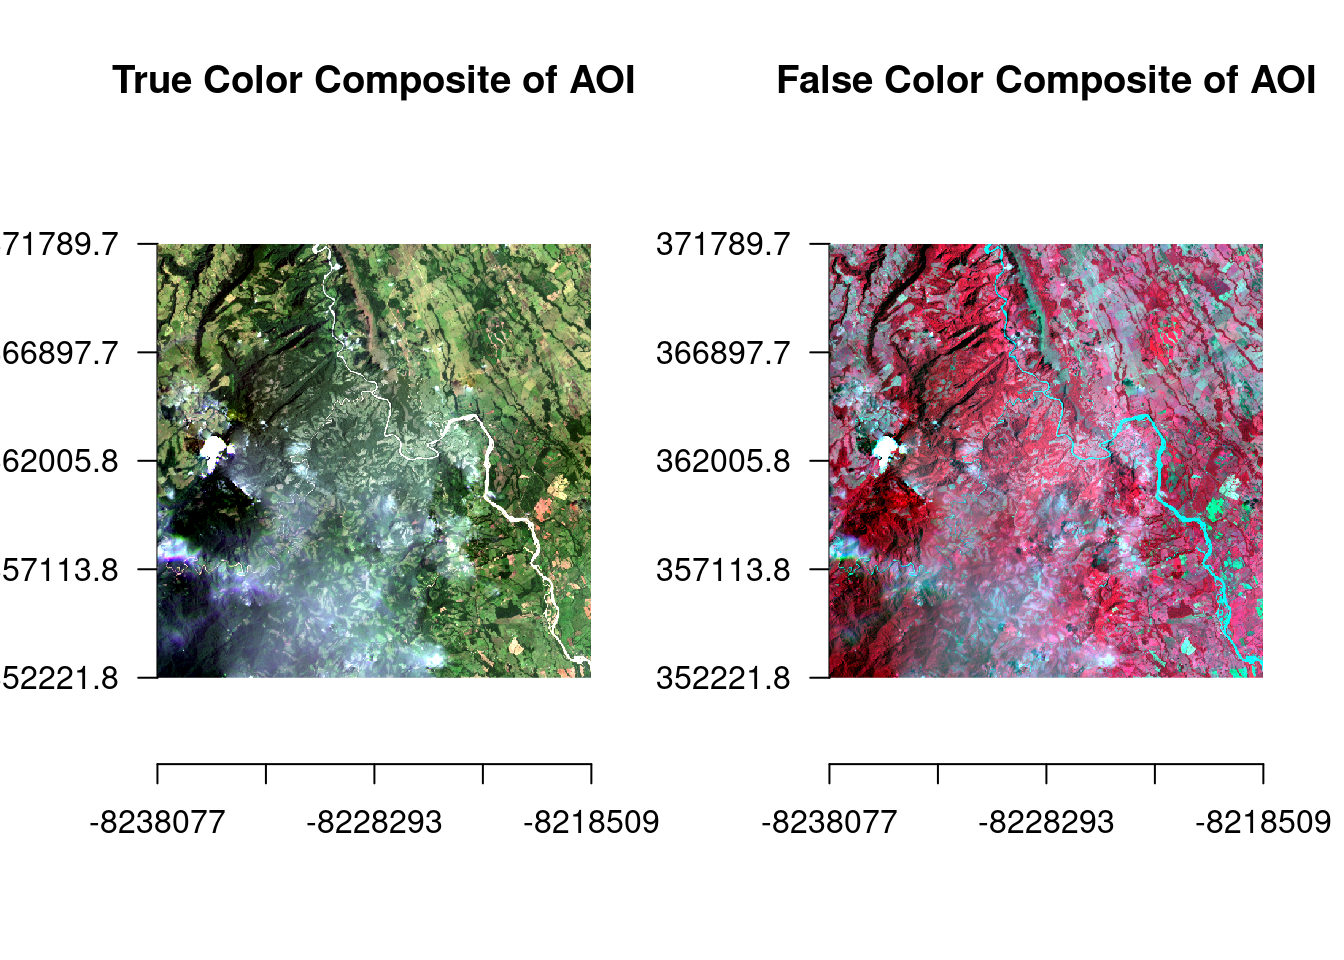
- Extract information embedded in the layers (bands) of satellite imagery. Different arrangements of the layers render different information more prominently. In the first image, a “true color” composite visible to the eye; on the right, a combination of red and near-infrared which highlights vegetation (in red).

Image: Courtesy of From Above team
- Extract information from the labeled image.
- Create a dataset based on visual inspection and contextual knowledge on the area (a.k.a. annotating the image).
- Ensure the annotated dataset and the satellite image are compatible in terms of extent, reference system projection, and resolution. In this case, we have annotated the same image so we had compatible files, but it’s possible that, for instance, the annotation tool adds or removes some information from the original image so this ensures you have the necessary elements.
- Extent — Latitude and longitude should be the same as the shape that belong to the two files.
- System projection — They should have the same coordinate reference system.
- Resolution — They should both have the same meters per pixel resolution.
- Merge the satellite information and the annotation information together. In what is called a ‘supervised’ model training, you provide the classifications that you are making the model learn deliberately. In an ‘unsupervised’ method, you let the computer automatically detect the number of classifications you decide. This can be a lot faster than annotating, but you could lack critical context that is only available to the human eye.
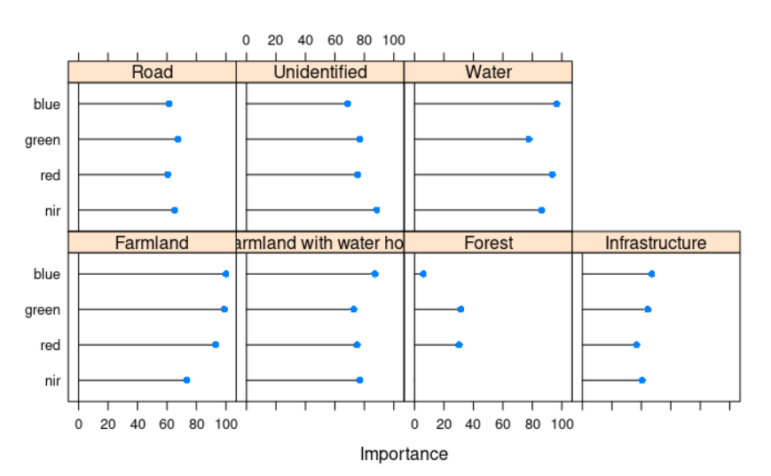
Image: Courtesy of From Above team
- Ask the machine to learn the inherent associations between all the layers of information (train the algorithm). You can choose between different methods for association learnings. For instance, we chose the Random Forest algorithm, but you could also use the Supervised Vector Machines algorithm, or any other.
- The associations between the categories and inherent information are encoded in the pixels of each layer in the satellite image. For instance, the strength of associations between our classification work and each layer is plotted down below. There are some layers of information that are going to be better than others at predicting specific categories of your classification.
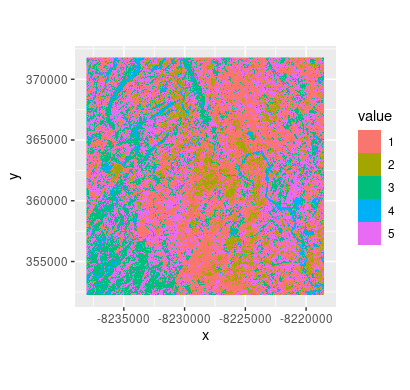
The final result from the image segmentation algorithm. Image: Courtesy of From Above team
- Test it with unseen satellite data. Hopefully you have now spotted some interesting visual information from the images and computational techniques to back up a story or spur more in-depth reporting
An in-detail version of these steps are developed in the From Above repository for complete reproducibility on GitHub here or here.
Resources:
This is a list of compiled resources that we benefited from and would recommend to others:
-
- Data sources:
- Planet API
- Planet NICFI
- You can find online information at Maxar’s news bureau, Planet’s news section, and Skytruth also chronicles its projects. There is Descartes Lab. We also tried to reach out to the MAAP project for Amazon rainforest imagery, based on images from Sentinel, funded by the Norwegian government.
- Stories and papers that inspired us:
-
- Spotting elephants with Worldview 3 from Maxar (Oxford). We looked at their Elephants Spotting Research Paper to look for possible synergies.
- WiDS datathon to detect oil palm plantations. (Stanford)
- Open source detection of garbage.
- Link to the Counting Cows academic paper research about image quality to count cows.
-
- Data sources:
Additional Resources
Interpreting Data: Tips to Make Sure You Know How to Read the Numbers
How One Mexican Data Team Uncovered the Story of 4,000 Missing Women
The From Above team of five data journalists (spread across North and South America) came together as part of a six-month Journalism AI collaboration organized by POLIS, a media think-tank at the London School of Economics in 2020. It focused on looking at the climate crisis through observation via satellite imagery and experimented with computer vision techniques. It published this guide and the corresponding open source prototype (on github) with the hope that it serves as a stepping stone for deeper reporting. The members of the team and links to their biographical information follows:
-
- Maria Teresa Ronderos from CLIP (in Colombia)
- Flor Coelho from LaNacion (in Argentina)
- Gibran Mena from Data Critica (in Mexico)
- David Ingold & Shreya Vaidyanathan from Bloomberg News (in US)
Reporter’s Guide to Investigating Carbon Offsets — Short Version
How to Identify and Investigate AI Audio Deepfakes, a Major 2024 Election Threat
Tipsheet for Investigative Journalists on War Crimes and Open Source Research
Holding Your Government Accountable for Climate Change Pledges

Spill-Tracking Data Sources to Help Cover Hazmat Events and Environmental Disasters

GIJN Toolbox: Cutting-Edge — and Free — Online Investigative Tools You Can Try Right Now
Reporter’s Guide to Investigating Carbon Offsets — Short Version
How to Identify and Investigate AI Audio Deepfakes, a Major 2024 Election Threat

This work is licensed under a Creative Commons Attribution-NoDerivatives 4.0 International License
Republish our articles for free, online or in print, under a Creative Commons license.
Republish this article
This work is licensed under a Creative Commons Attribution-NoDerivatives 4.0 International License
Read Next
Data Journalism Reporting Tools & Tips
Spill-Tracking Data Sources to Help Cover Hazmat Events and Environmental Disasters
Environmental journalists should check out the new database tool Spill Tracker, but should also bookmark these other resources for reporting on hazmat events.
Reporting Tools & Tips
GIJN Toolbox: Cutting-Edge — and Free — Online Investigative Tools You Can Try Right Now
GIJN highlights some new, free investigative tools on fact checking, topic briefing, and journalist privacy that were the subject of significant interest in the hallways at the 2024 NICAR conference.
Guide Climate Investigative Techniques Methodology
Reporter’s Guide to Investigating Carbon Offsets — Short Version
Carbon offsets are truly an international climate change story. This short version of our GIJN guide helps reporters understand, research, and investigate the global players.
Tipsheet Investigative Techniques Reporting Tools & Tips Research
How to Identify and Investigate AI Audio Deepfakes, a Major 2024 Election Threat
Experts agree that AI-driven audio deepfakes could pose a significant threat to democracy and fair elections in 2024.